
Money in and out
Reports adds up the academy’s money: student fees coming in, salaries and expenses going out, and what is still owed. Owners, admins, and anyone with a finance permission can open it. Each person sees only what their permissions cover — somebody allowed to see salaries alone sees the salary side.
The figures cover the last twelve months, up to today. The location switcher at the top of the screen narrows every report to one location, and Showing: under the title names the part of the academy the figures are for.
The totals
Section titled “The totals”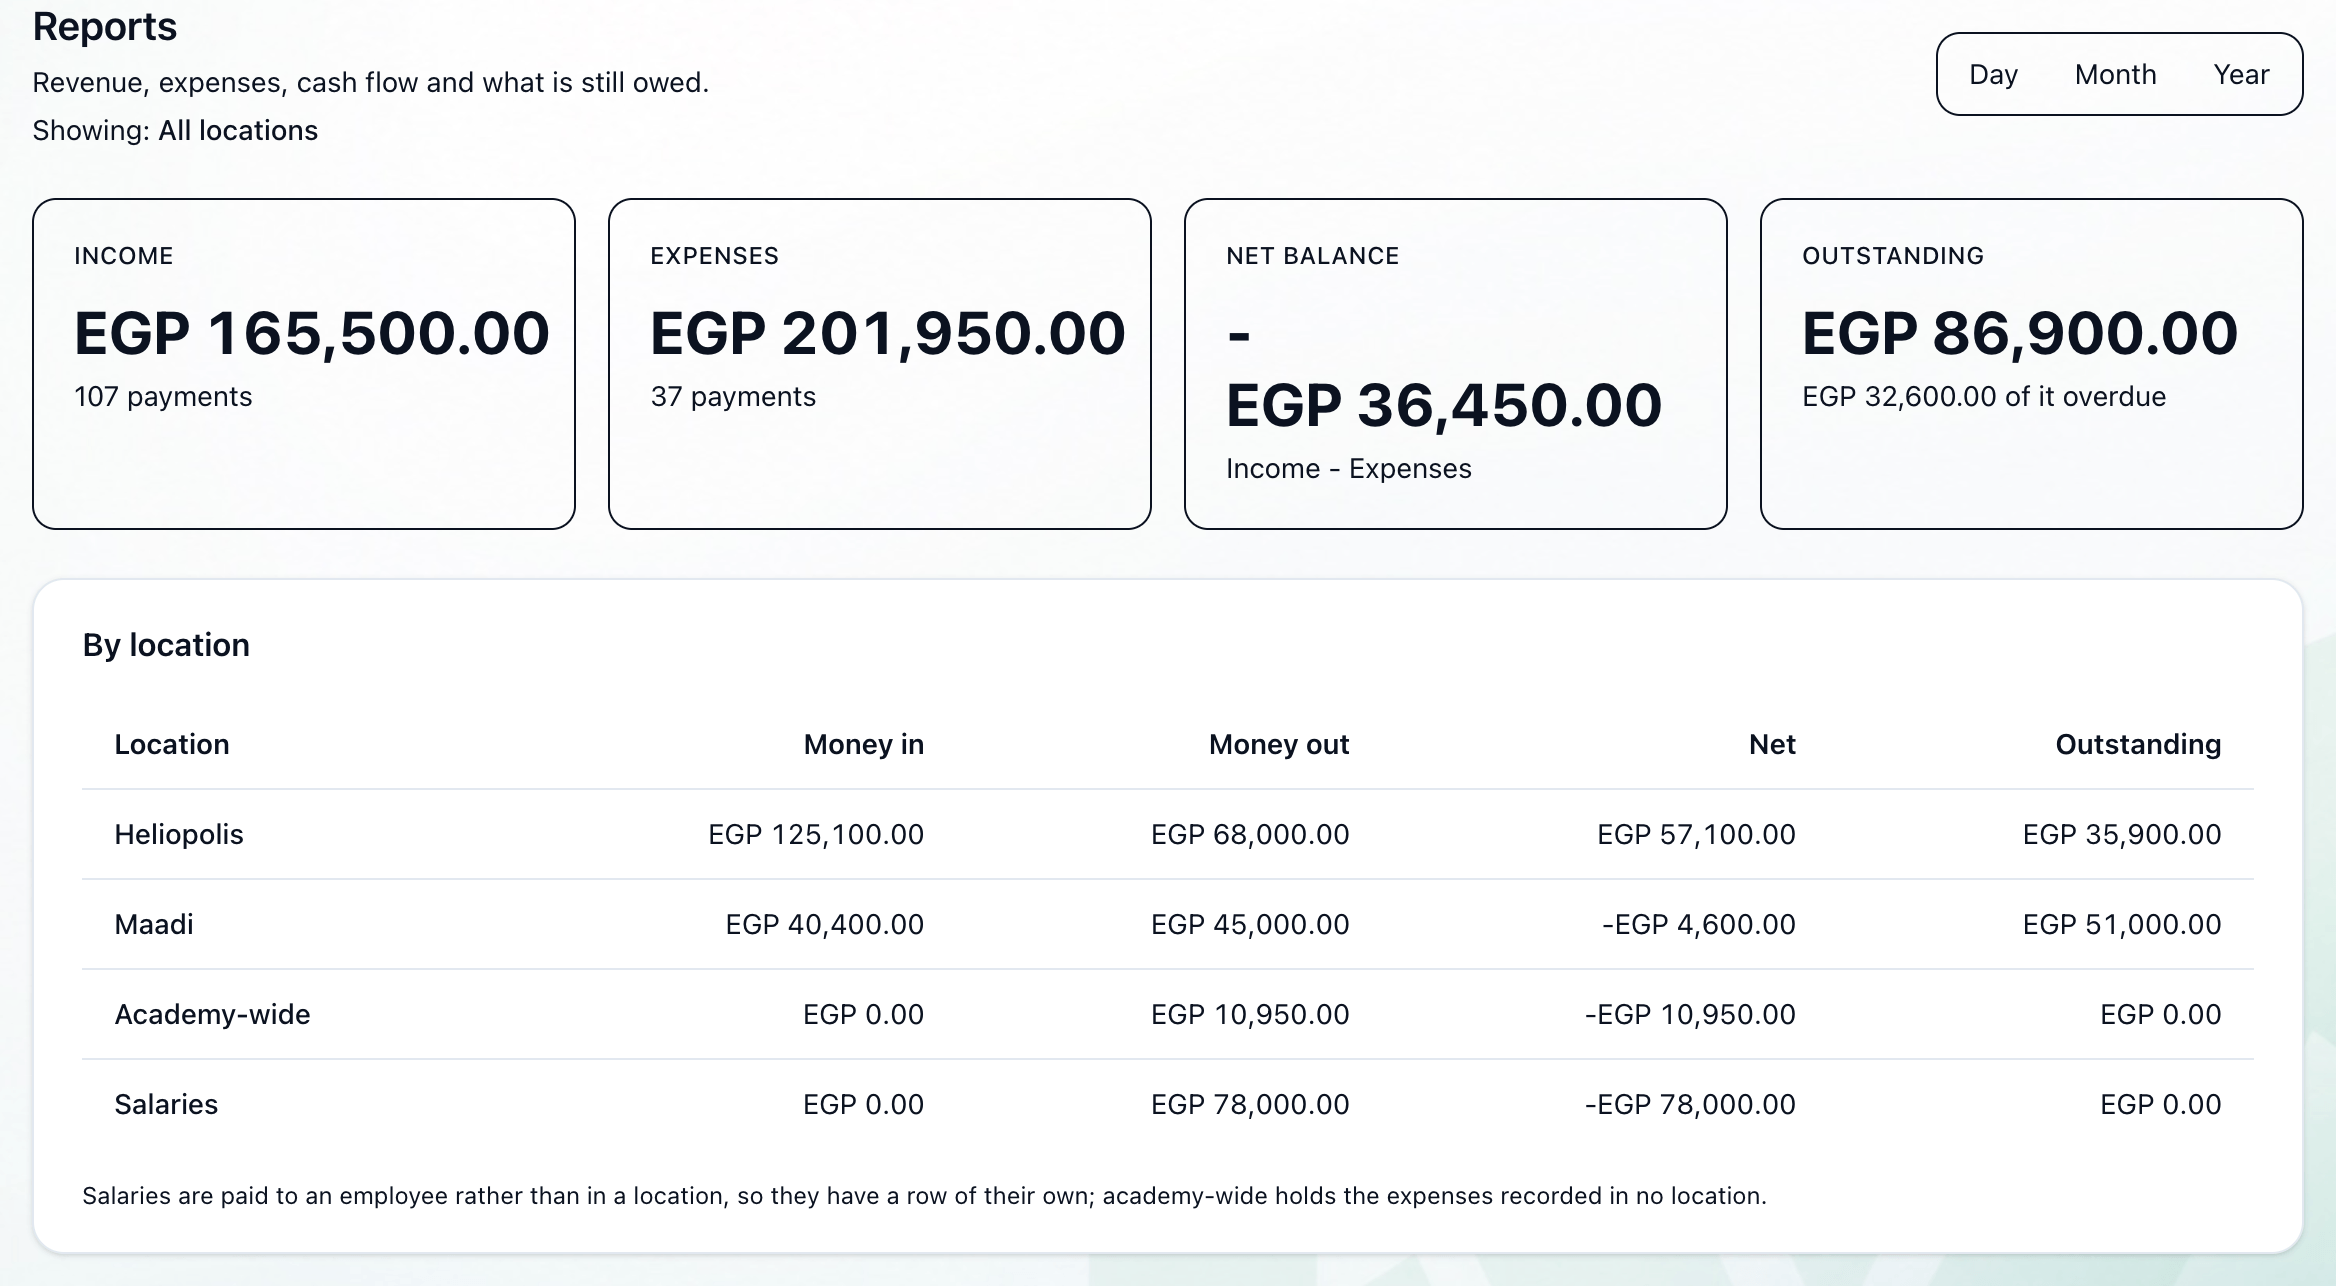
- Day, Month, Year
- The totals
- By location
-
Day, Month, Year
How the charts group the money: a point or bar for each day, month or year. The totals do not change. -
Income
The student fee payments recorded, and how many there were. -
Expenses
Salaries and expense payments together, and how many there were. -
Net Balance
Income - Expenses. A minus sign in front means more went out than came in. -
Outstanding
What students still owe on their fee agreements today, and how much of it is overdue — see What is owed. -
By location
Money in, Money out, Net and Outstanding for each location. Salaries are paid to an employee rather than in a location, so they have a row of their own; Academy-wide holds the expenses recorded in no location. The table shows for people who hold every location, when the academy has more than one.
The trend and the expenses
Section titled “The trend and the expenses”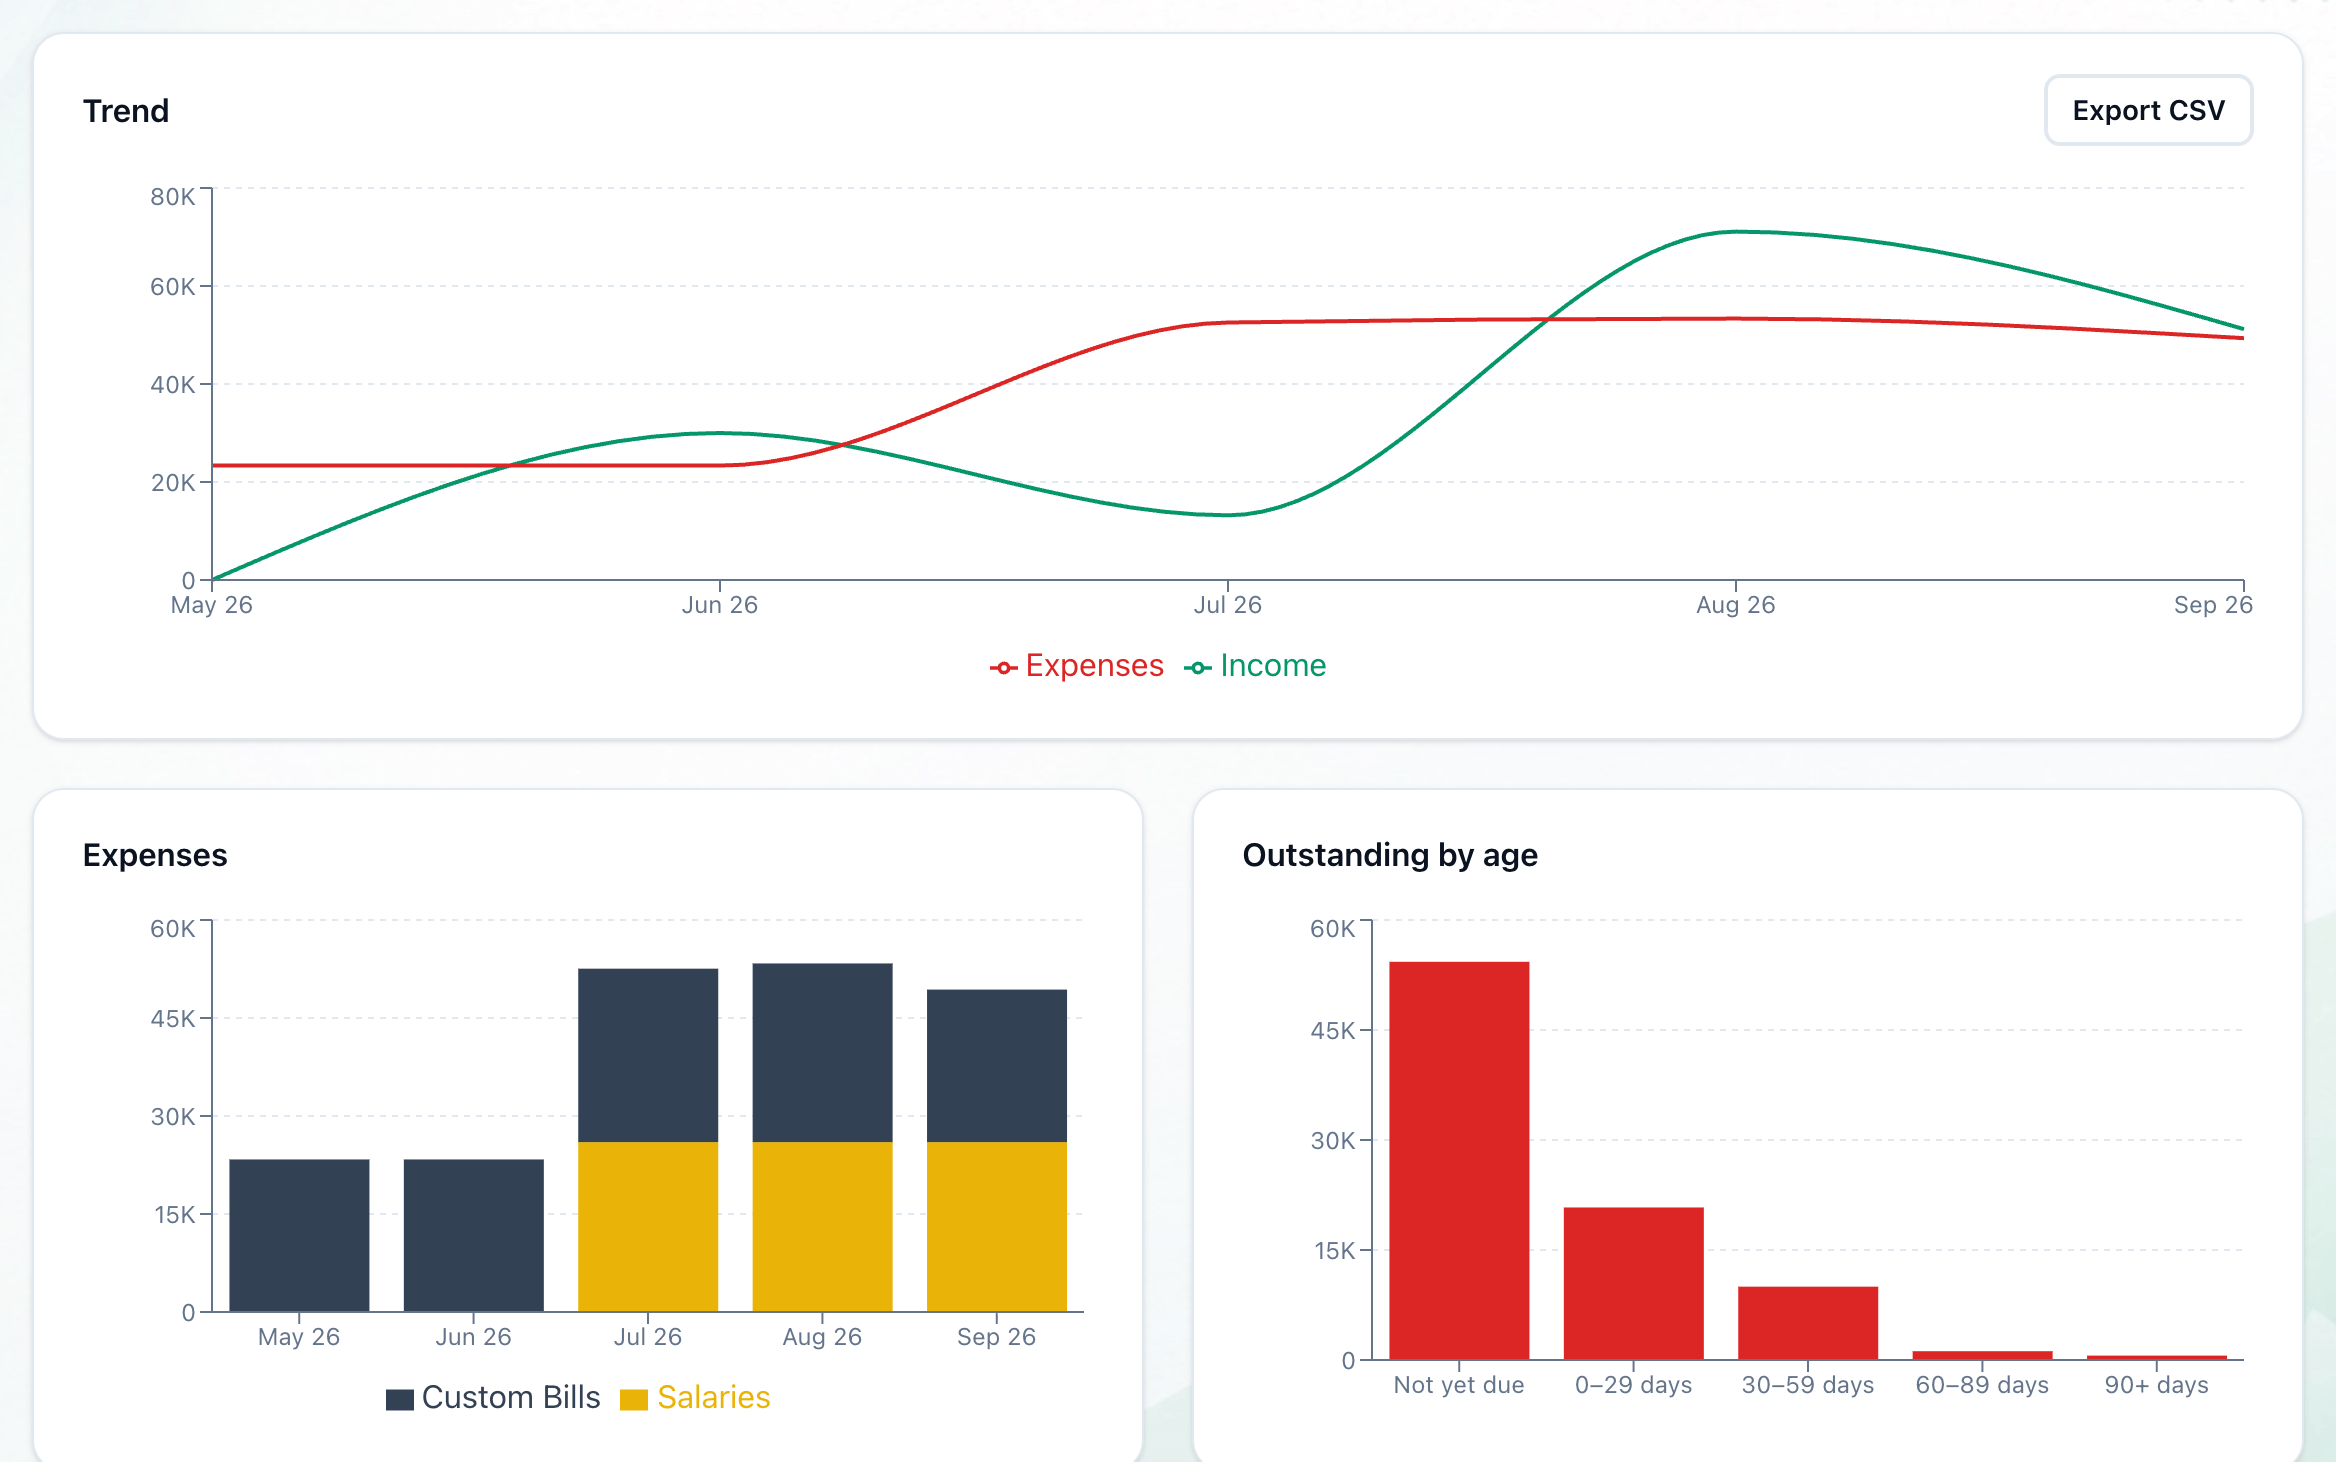
- Trend
- Expenses
- Trend draws Income and Expenses side by side over the twelve months.
- Expenses stacks each bar from Salaries and Custom Bills, so you see what went out and what it went on.
What each group earned
Section titled “What each group earned”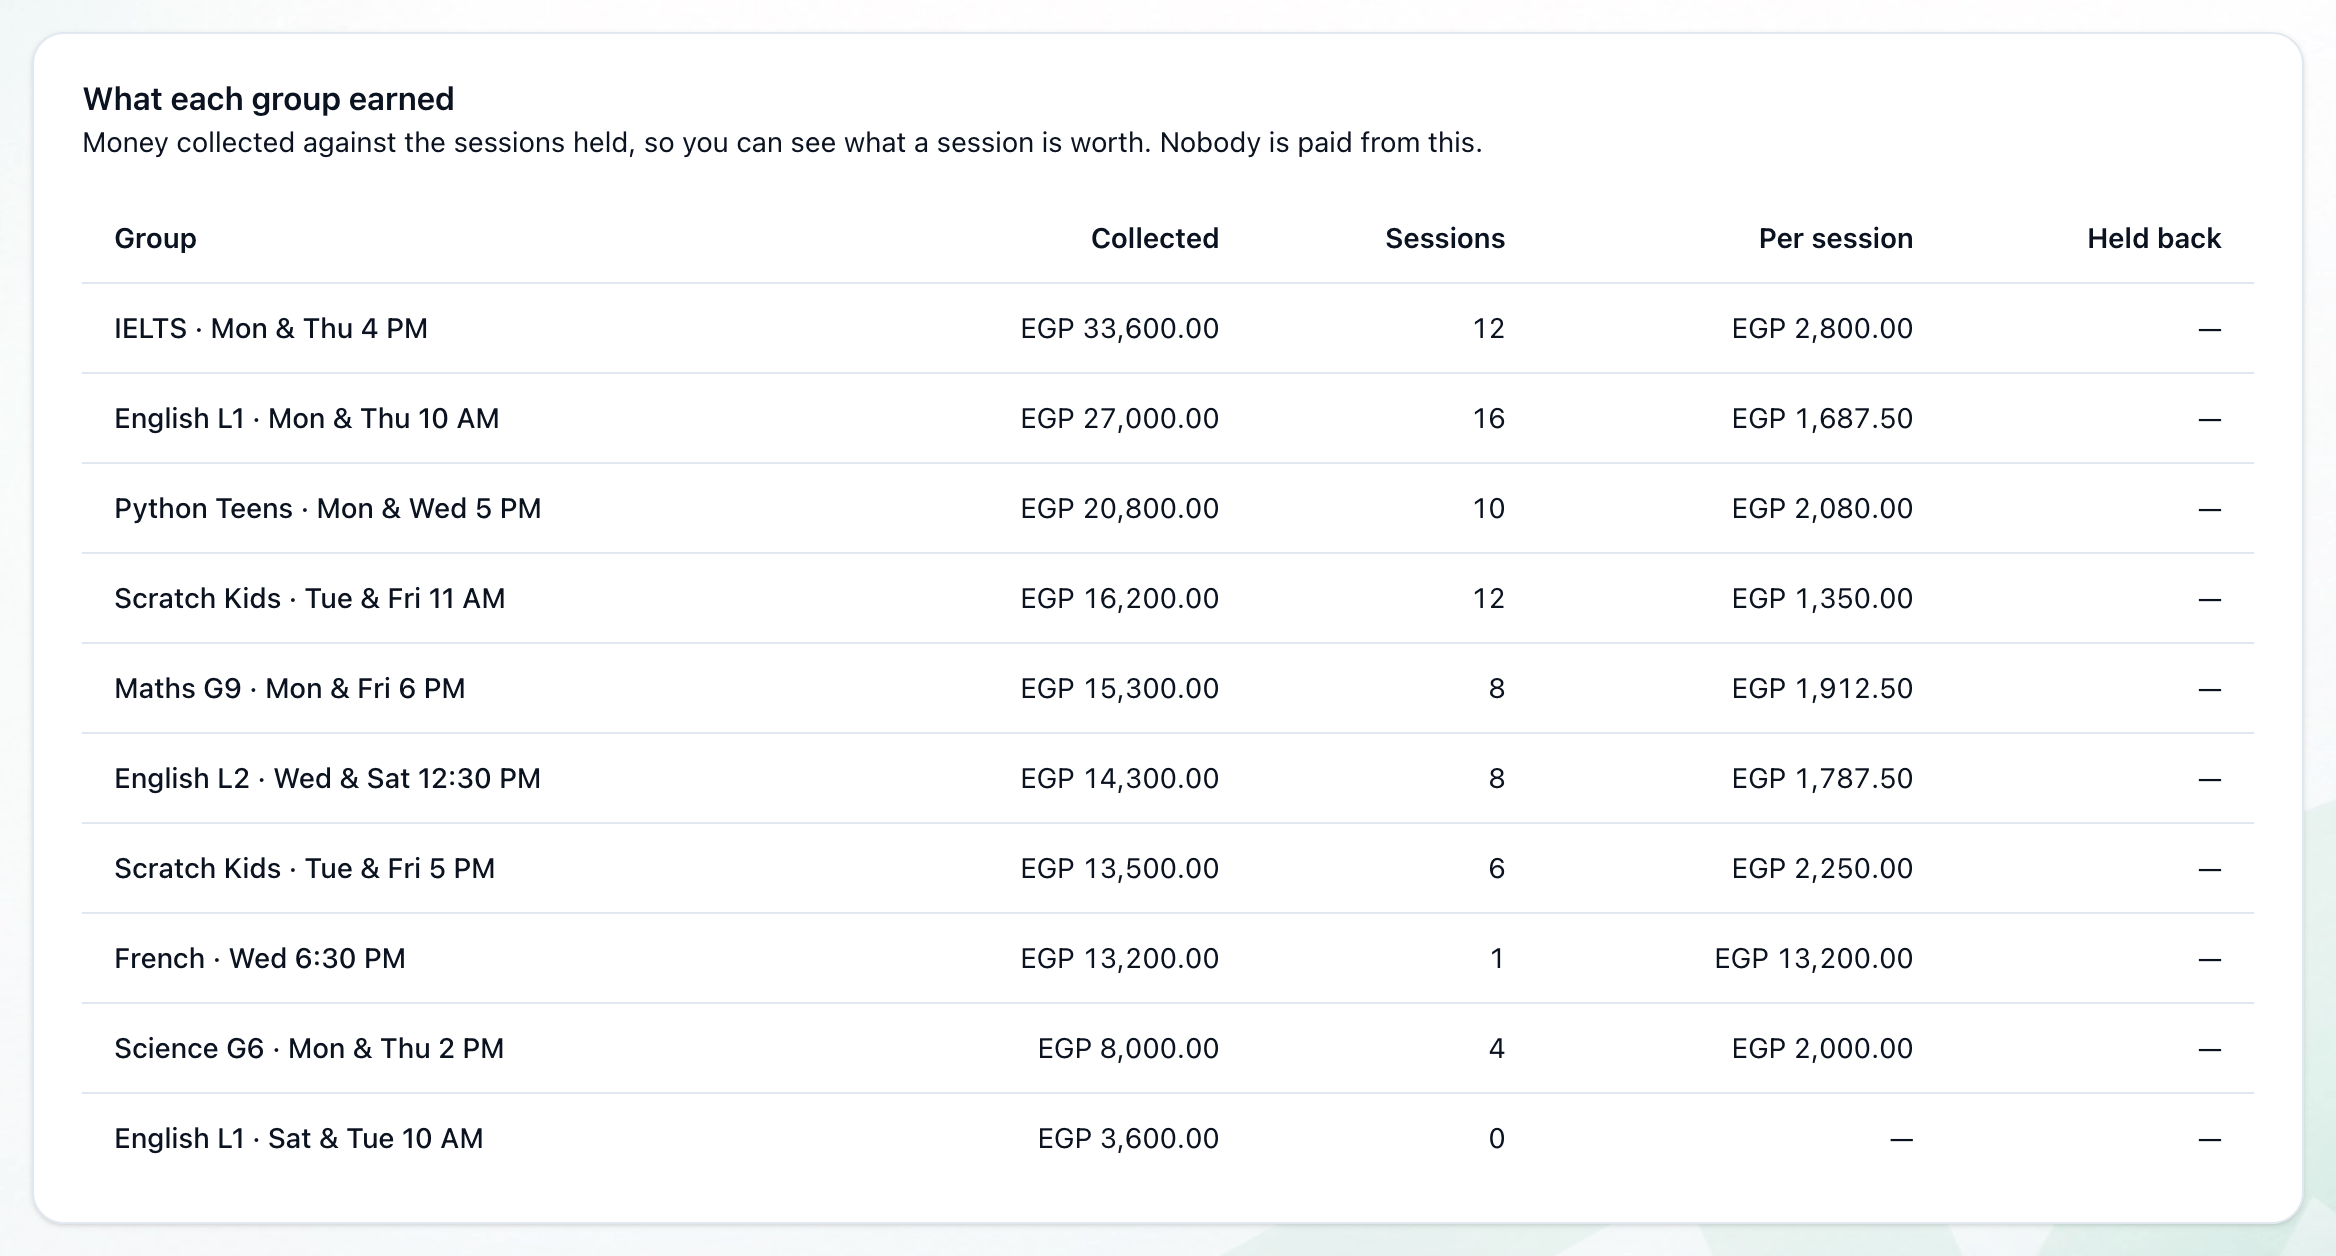
- What each group earned
For each group: the money Collected in the twelve months, the Sessions it held, what a session was worth (Per session), and any money Held back — collected but not yet shared out as commission. A group that held no sessions shows — for a session’s worth. Nobody is paid from this table; it shows whether a commission rate is fair. Press a group’s name to open it.
Export the trend
Section titled “Export the trend”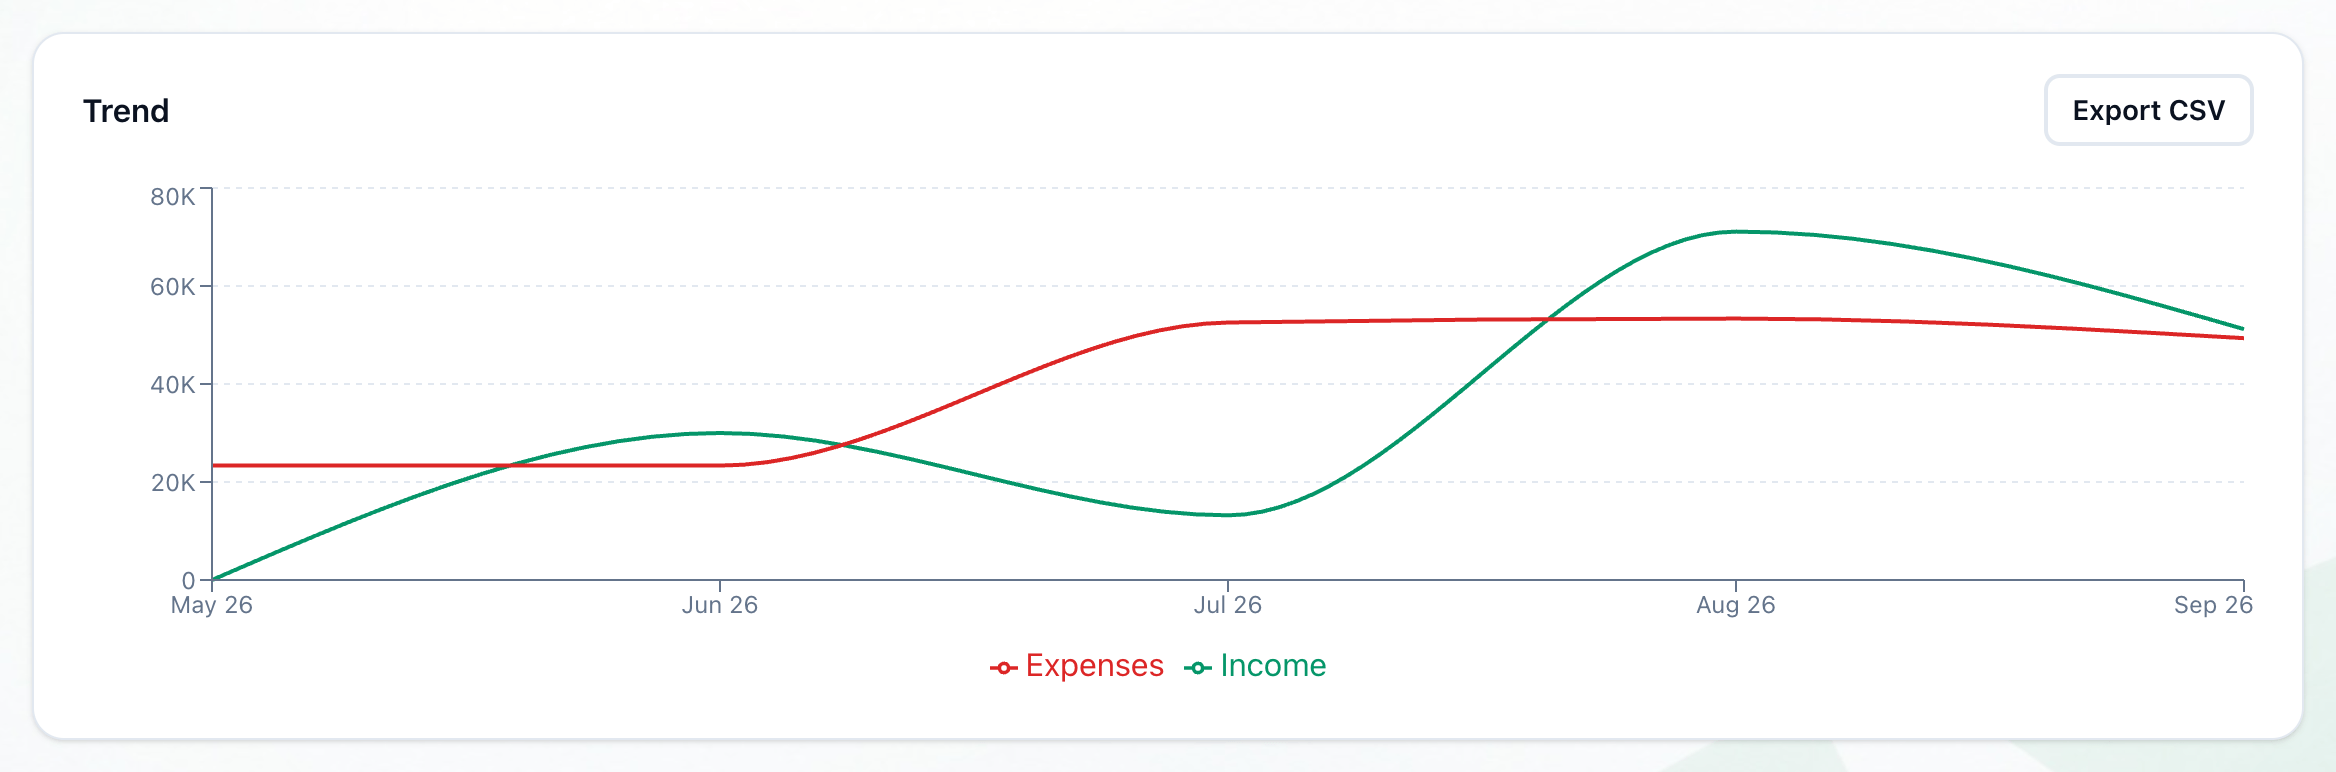
- Export CSV
-
Choose Day, Month or Year.
-
Press Export CSV on Trend. Your browser saves a spreadsheet with a row for each day, month or year: Period, Money in, Money out and Net.
The file opens in Excel with its columns named in your language.
What happens next
Section titled “What happens next”For what students still owe, and who owes most, see What is owed.